
How to navigate the analysis
Learn how to use and navigate the analysis.
Step 1
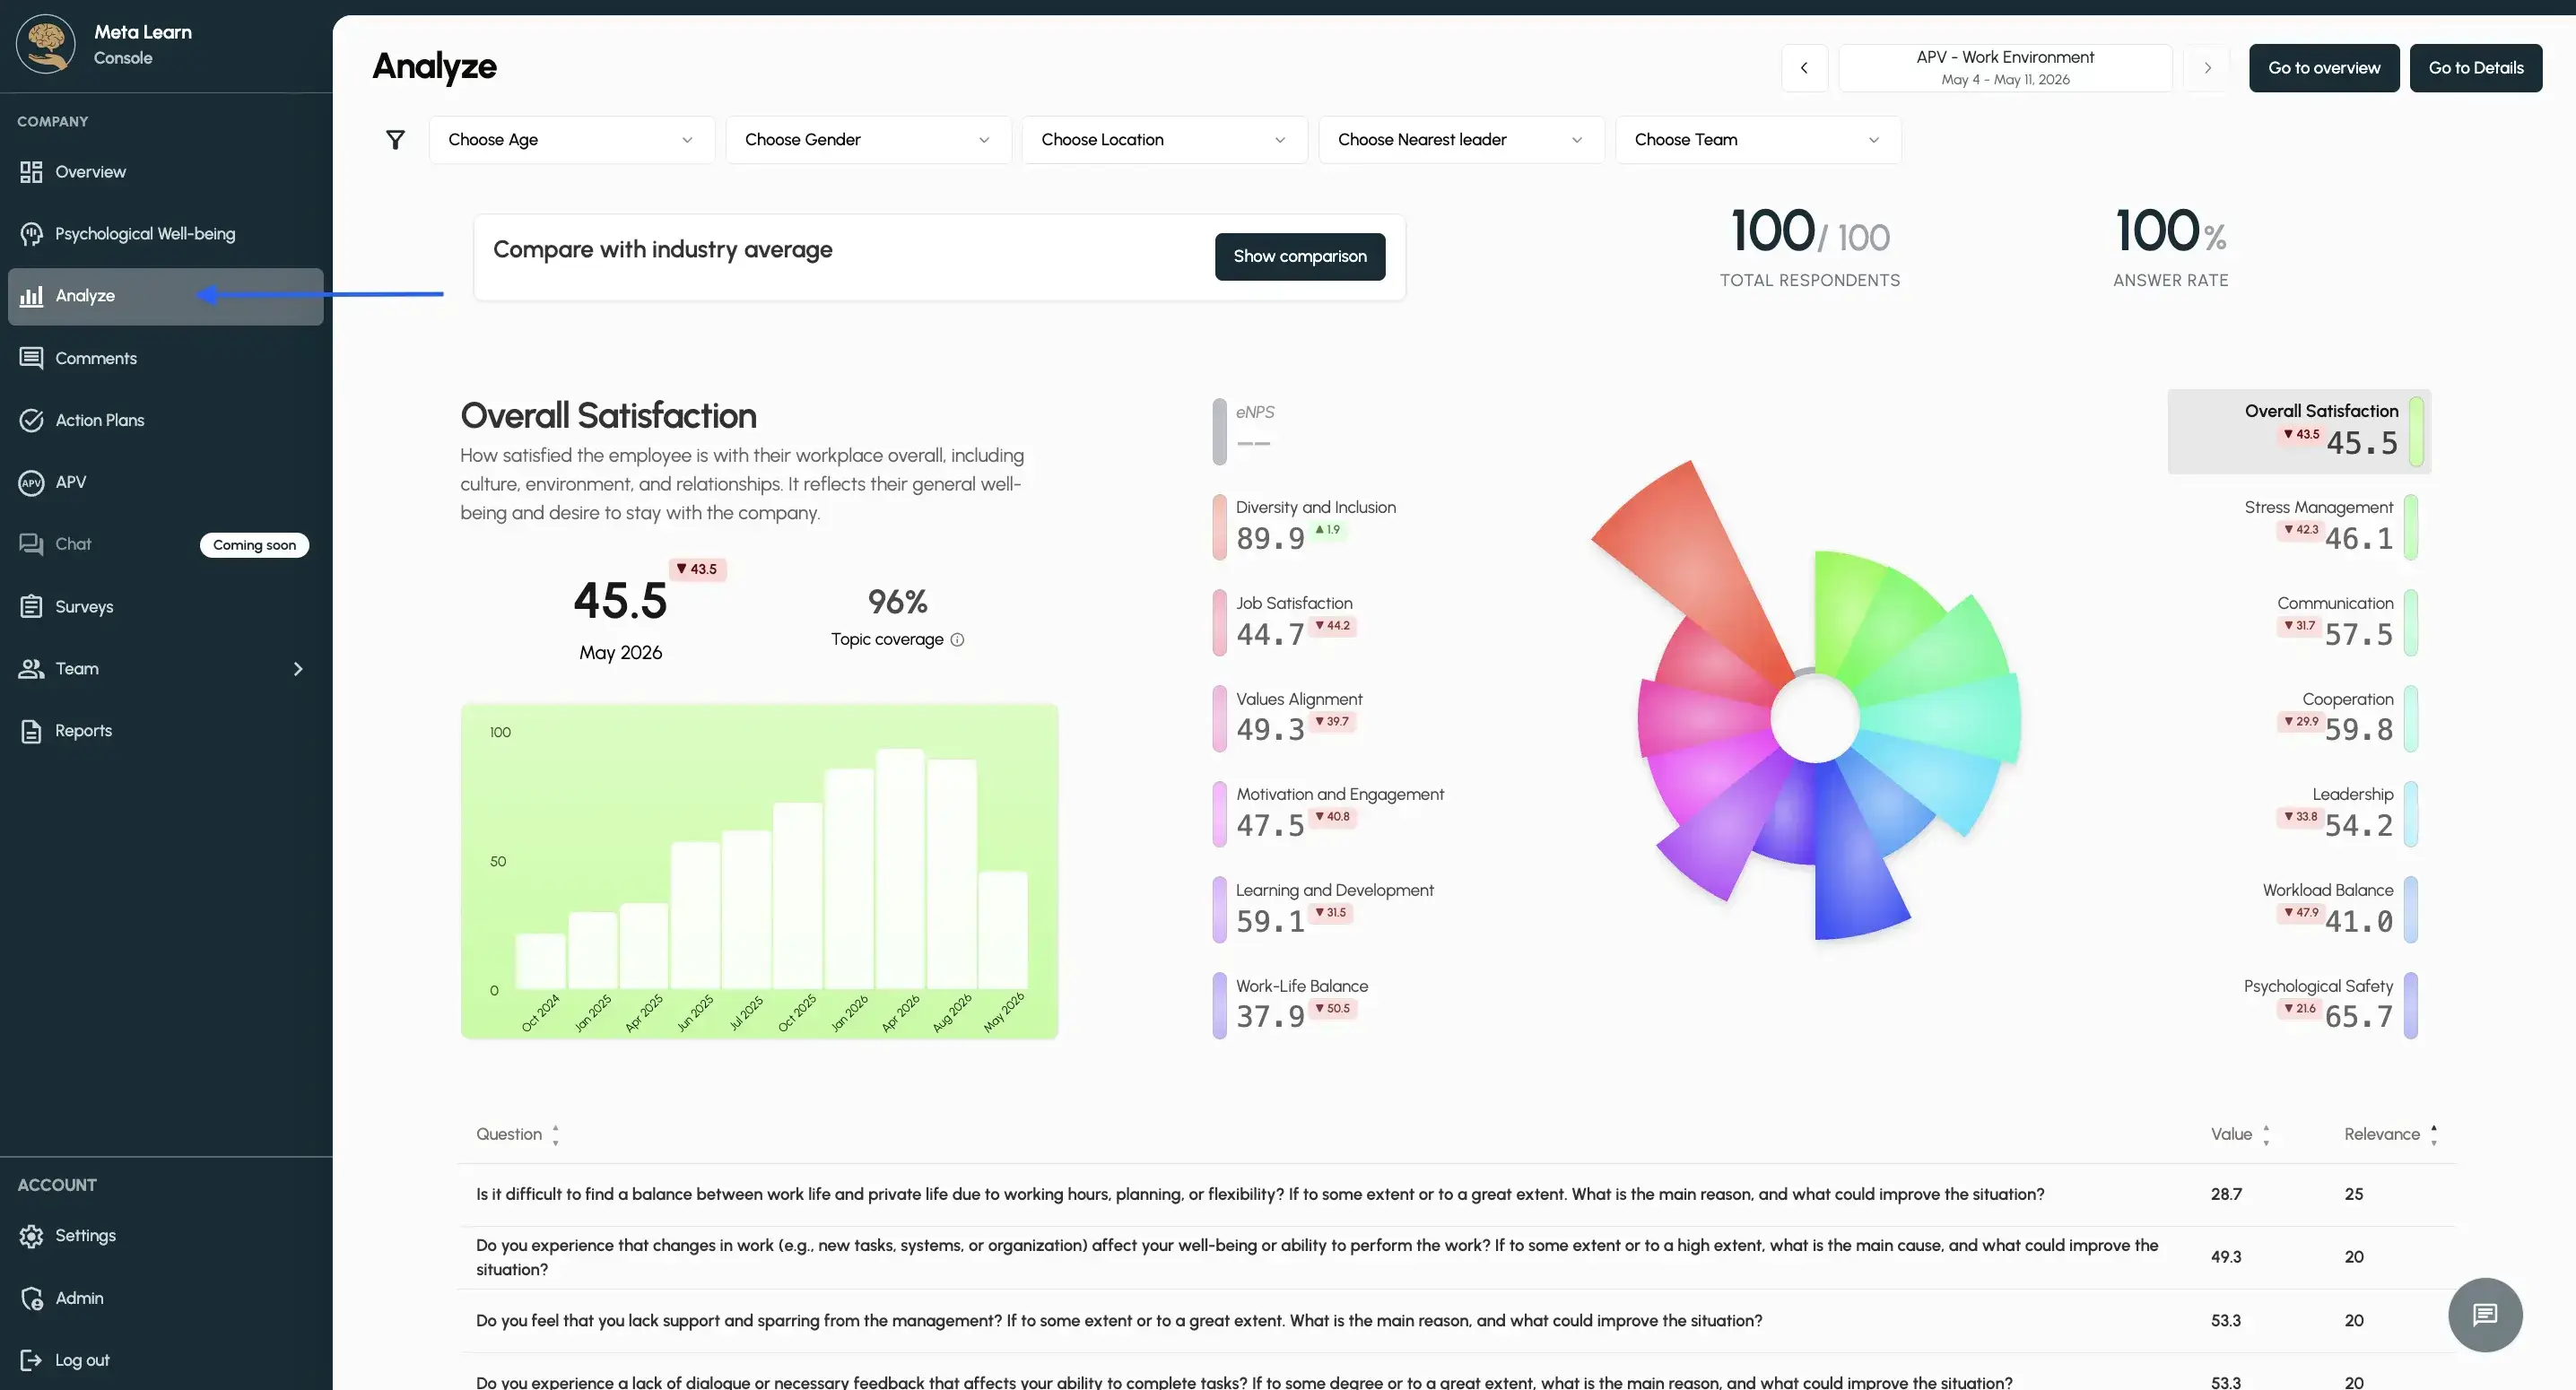
Click "Analysis" to open the dashboard for your latest employee engagement survey.
On the analytics page, you can get a complete overview of your latest survey and see how the results affect the different topics. You can click on any KPI to see how your company’s responses have developed.
Step 2
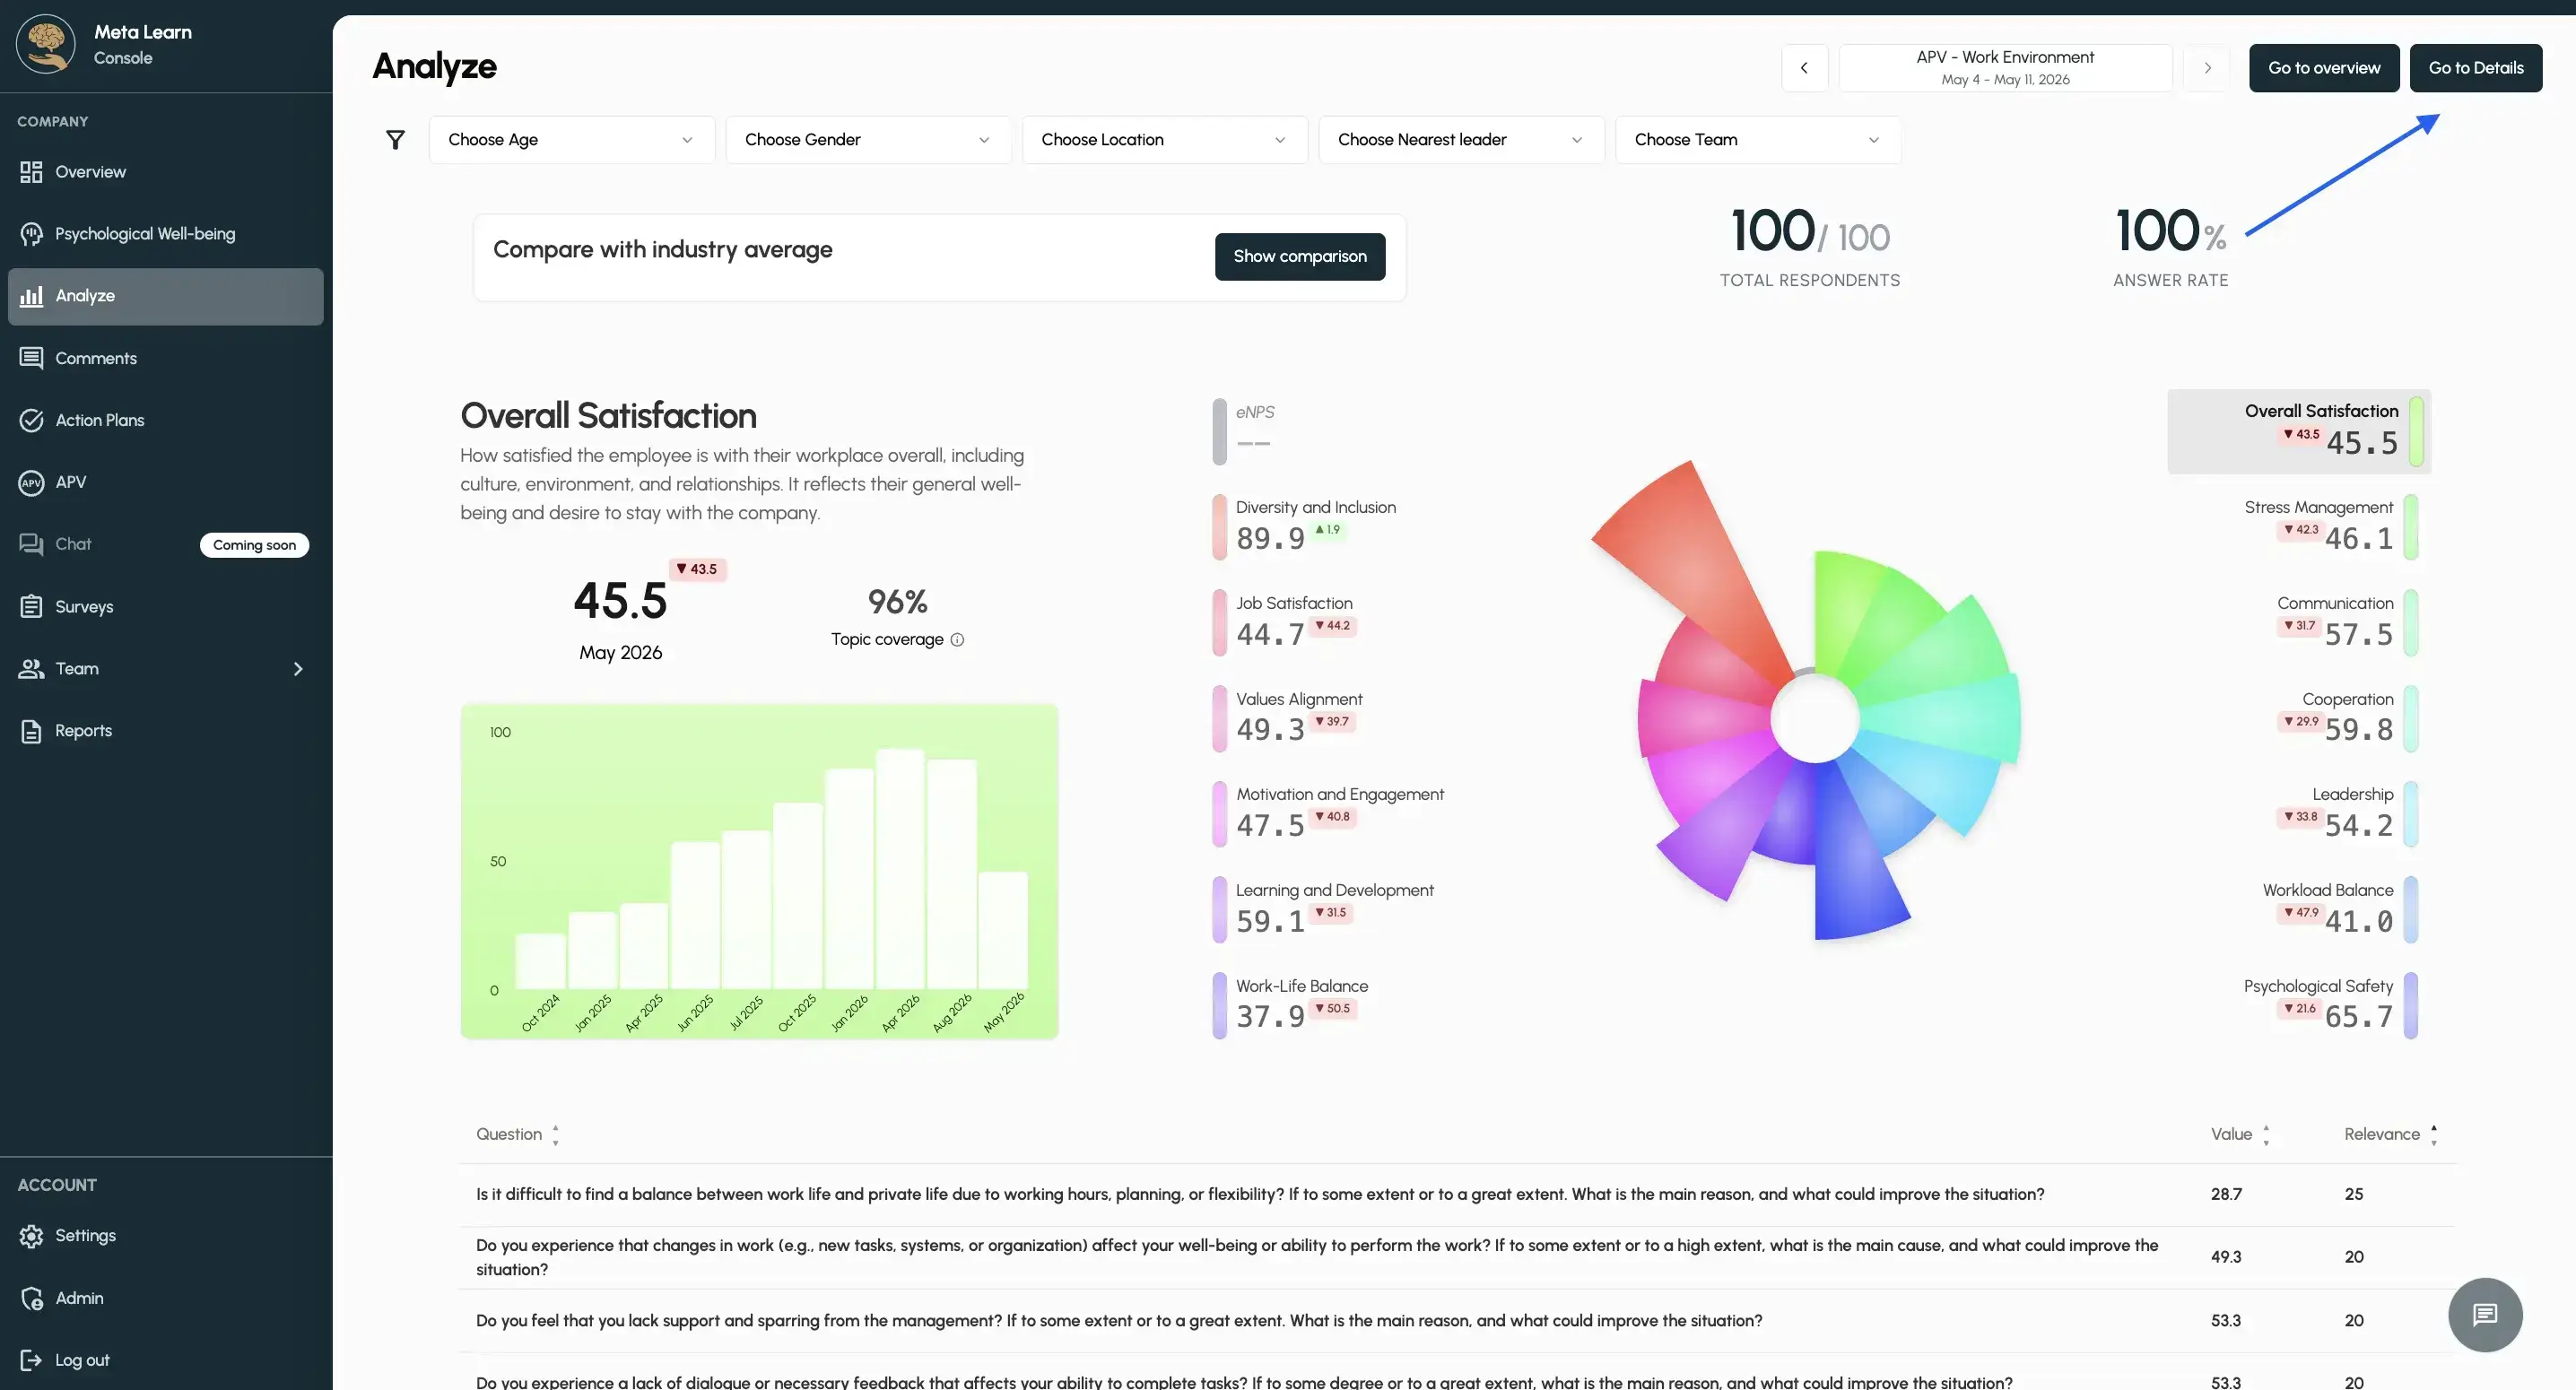
If you want to take a closer look at each question from your survey, tap “Go to details” to open the details page.
Step 3
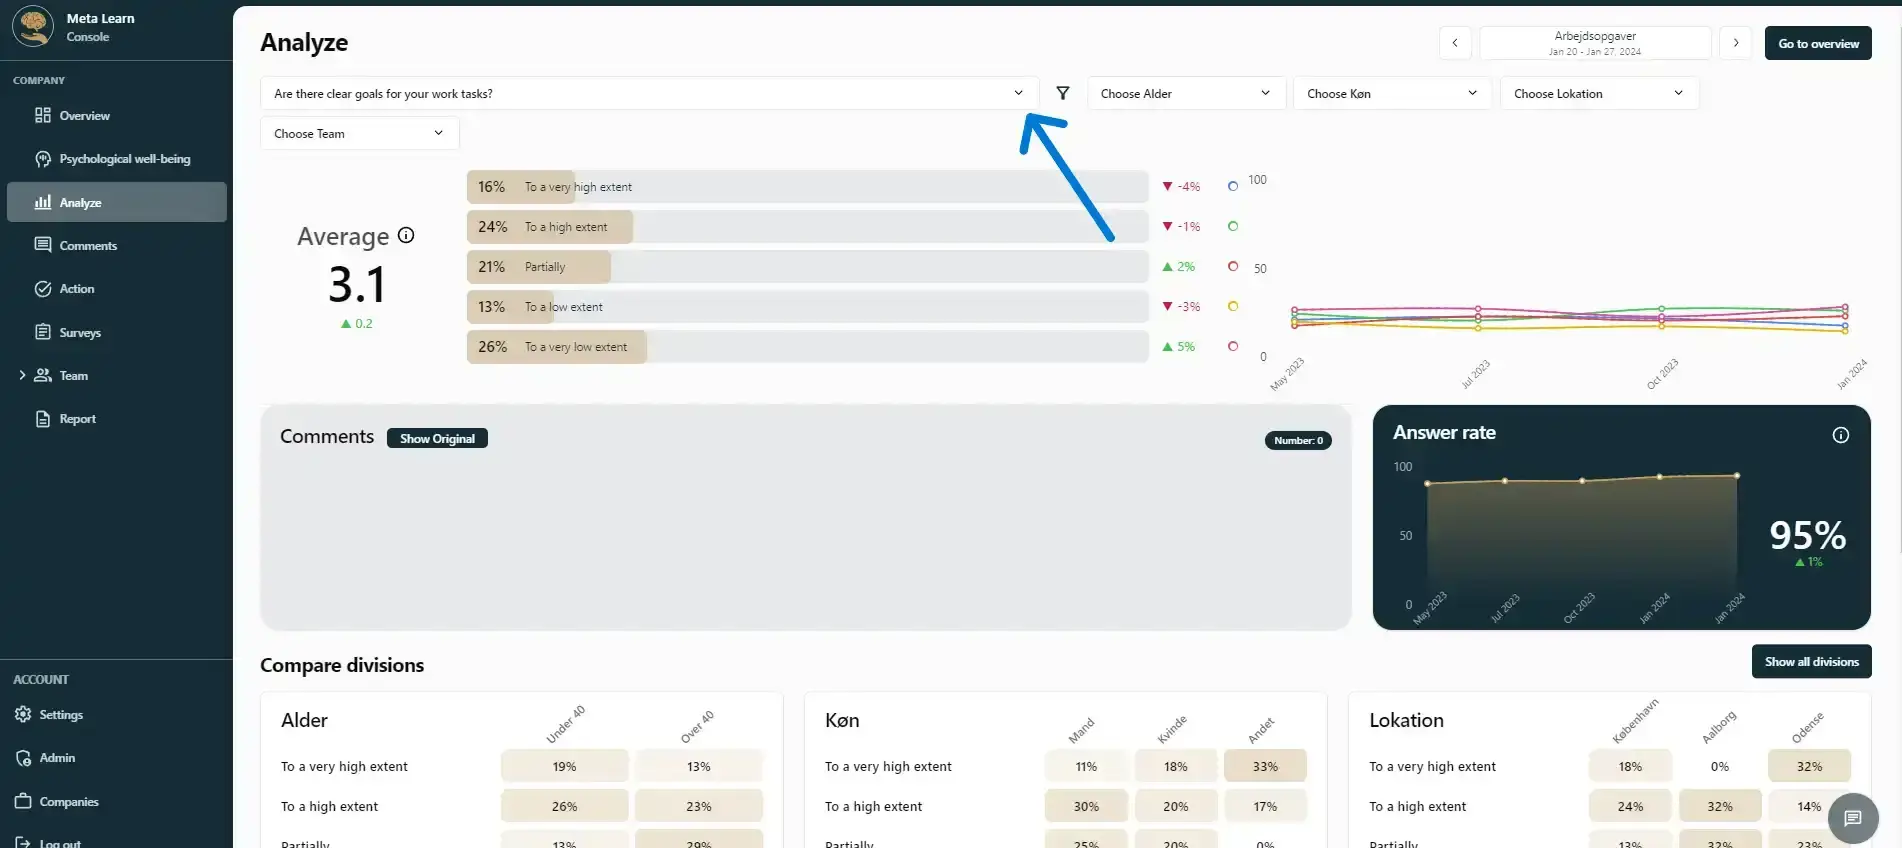
You can now choose between the different questions your employees have been asked. To switch between questions, click the down arrow to see all available questions.
Step 4
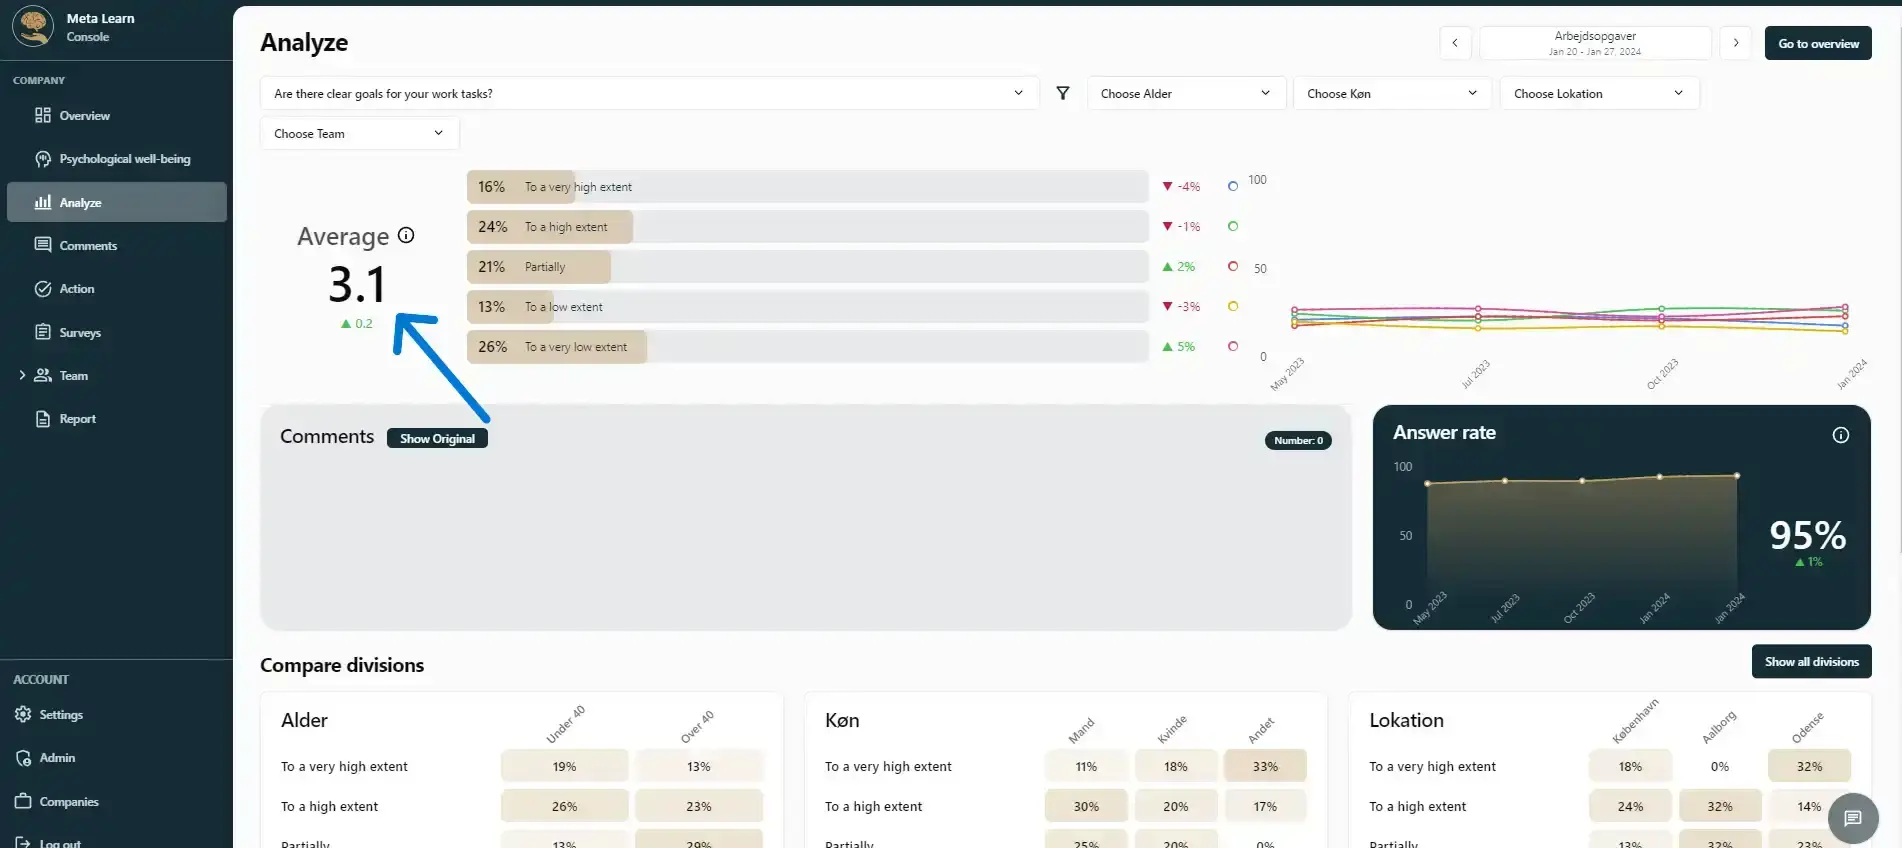
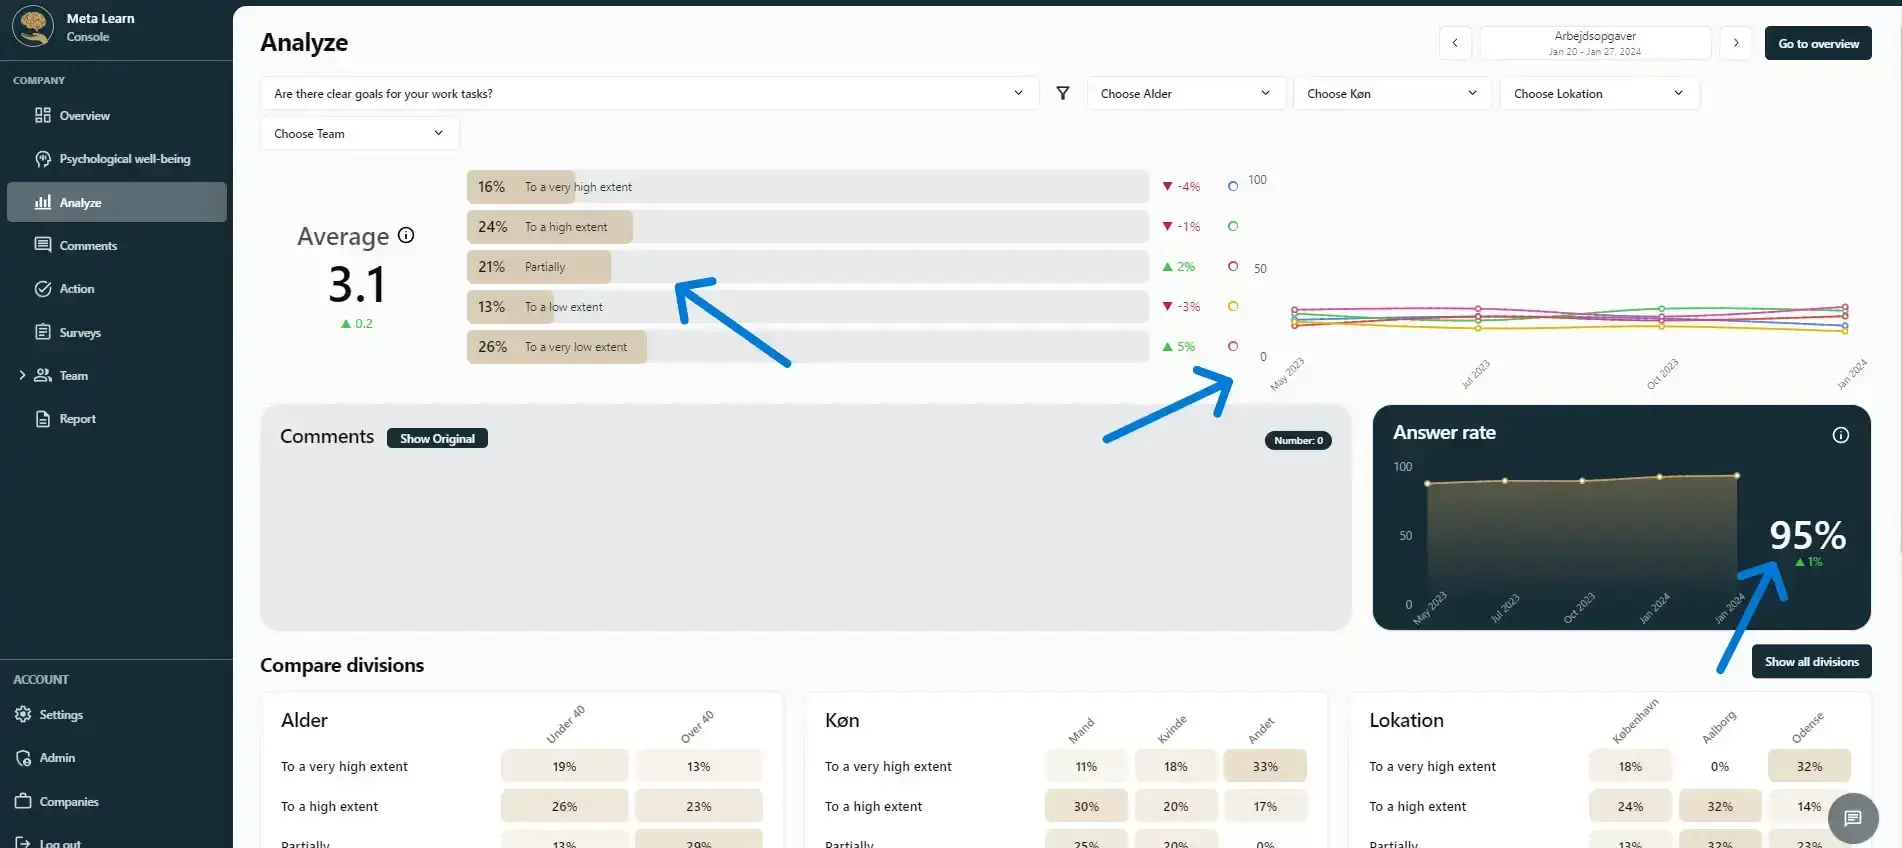
Each question has an overall score showing the average of the responses, so you can quickly and easily get an overview.
Step 5
Here you can see the distribution of responses, the response rate, and the historical trend for the selected question.
Step 6
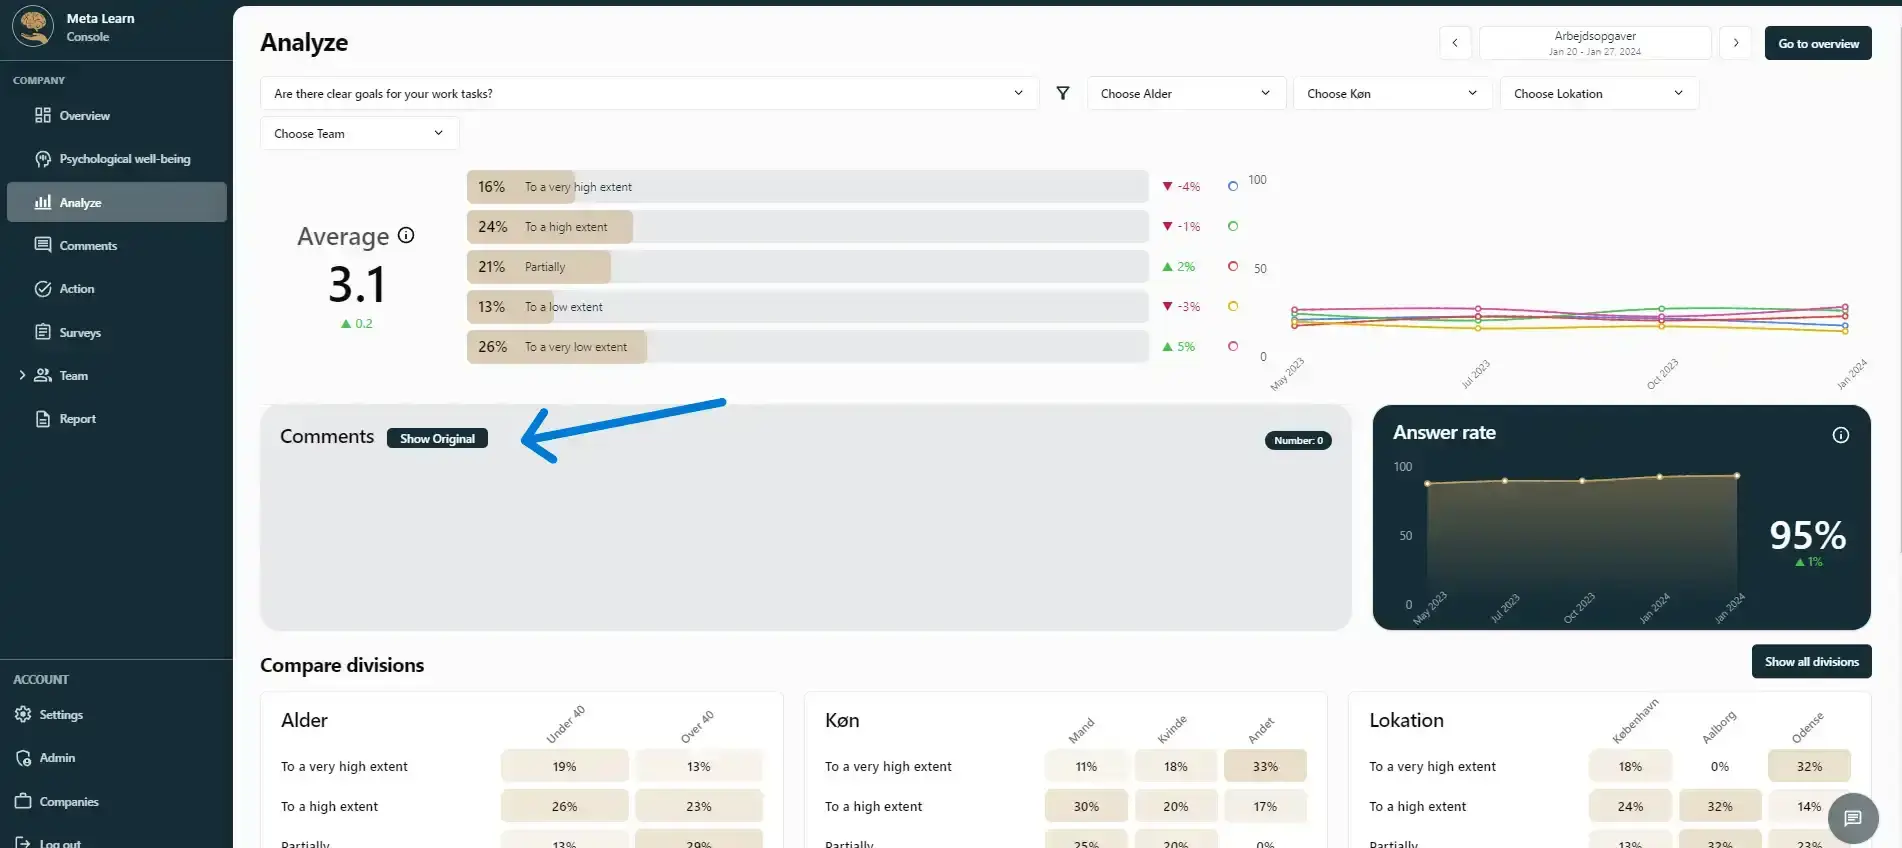
If any employees have chosen to comment on a question, their comments will appear in the section below. You can also choose to view the original comments in the language they were written in or have them translated automatically by clicking “Translate”.
Step 7
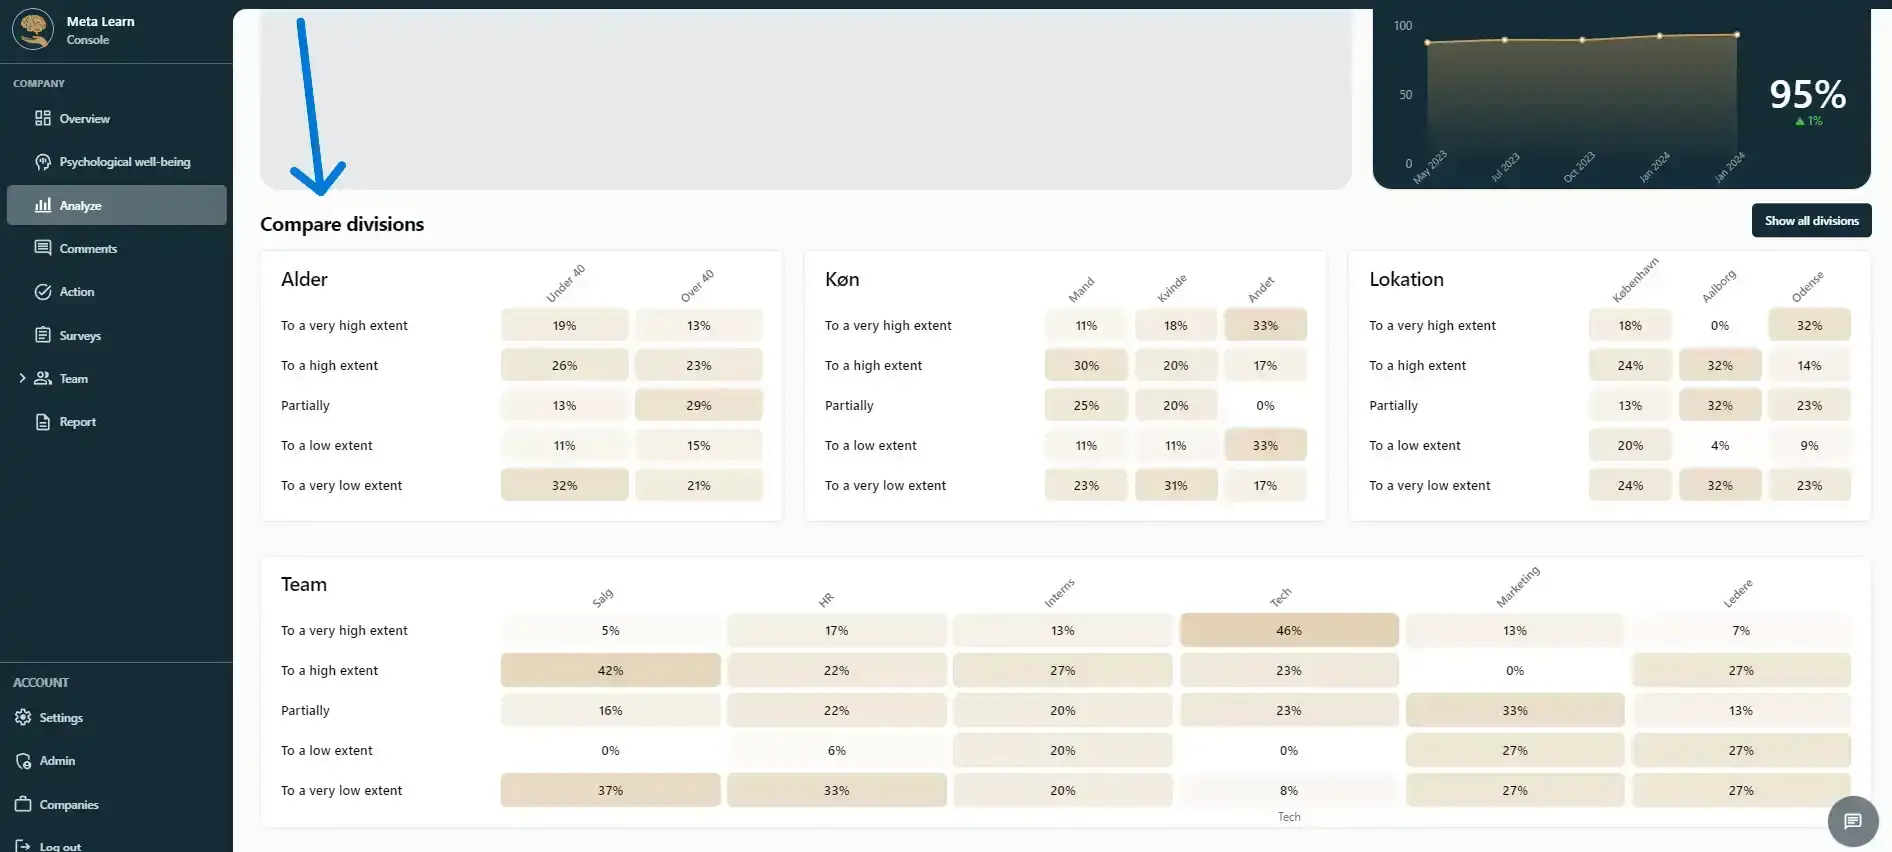
You can also compare different divisions and quickly identify which departments or teams need more attention than others. Comparing divisions makes it easier to take a closer look at the data and understand your employees better.
Related guides
Do your own research
Use Meta Learn’s templates or create a custom survey that fits your business perfectly.
View guideSurvey Checker
Review your questionnaire and get help making sure the questions are ready to send.
View guideUnderstand psychological well-being
Learn how to use and interpret your employees’ well-being surveys, and see what you can do based on the results.
View guide